Competitive companies are always looking for ways to manage risks. Whether they’re working on a root cause analysis, deploying new equipment, assessing damaged parts, or installing different hardware – knowledge is power.
This article discusses a high return approach that can answer many vibration questions in a fraction of the time it would take using FEA. This can be a real game changer when it comes to getting your hands around vibration risks, reducing analysis costs, or verifying FEA results.
FEA requires precise model geometry, knowledge of the part’s material, a good understanding of how the part is constrained, and can take weeks to complete. This is especially true if the part in question has internal passages or is made of anisotropic materials.
When it comes to vibration failures, frequencies and mode shapes may be all that is needed to assess the risks and drivers. Mode shapes can sometimes show how crack locations and propagation directions relate to a specific driver or frequency.
One way to speed up the analysis is to avoid the complex FEA approach by measuring the frequencies and mode shapes using tests.
You may already know that impact tests (ping or tap tests) are a well-established method for measuring frequencies – but did you know a series of impact tests can be processed to determine mode shapes? What’s even more compelling is that you don’t need a shaker table, holography equipment, or even a laboratory to do the tests.
Stream Lion Design set out to see how effectively tests could be used to determine compressor stator vane mode shapes and frequencies. The plan was to compare the test approach with FEA results to see if using EDM Modal by Crystal Instruments would be right for the job.
Besides being faster, here are some more benefits of the test approach:
- Being able to do modal studies on installed parts
- Bypassing the need for knowing material properties
- Not needing to do 3D scans
- Easily studying hollow and/or single crystal designs
Here we’ll compare EDM Modal along with the FEA approach to help you decide if this type of testing makes sense for your projects. This example uses a Combustion Turbine forward stage compressor stator vane.
EDM Modal Approach (Testing for Frequencies & Mode Shapes)
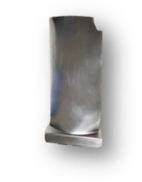
Once the stator vane was mounted on the bench (fixed at the dovetail), the chord and span were roughly measured using a ruler. These measurements were needed so a representation of the part could be approximated in the EDM Modal software. The software uses the simplified geometry to establish a test grid that identifies where impacts and responses will be measured. Mode shape animations are also displayed using the input geometry.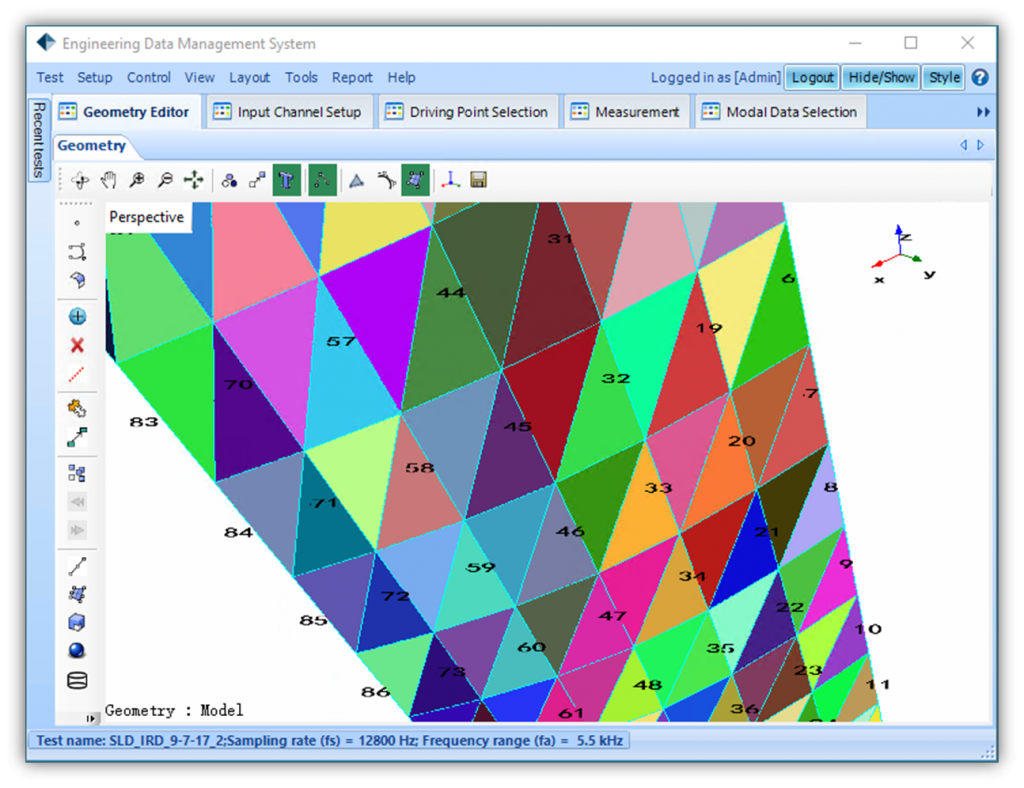
In this case, the geometry is built having a 13 x 7 test grid. The modeled grid locations were transferred to the actual airfoil surface using a pattern and marker. Next, a roving response test was done by impacting at the same location while sequentially moving the accelerometer throughout the different response points. EDM Modal then combines all of the measurements to determine the frequencies, damping coefficients, and mode shapes.
The mode shapes were ready to review after only two hours of testing.
Here are a few of the results. These figures show mode animations overlaid on top of the undeflected geometry. The airfoil is oriented tip down with the constrained end at the top of the screen.
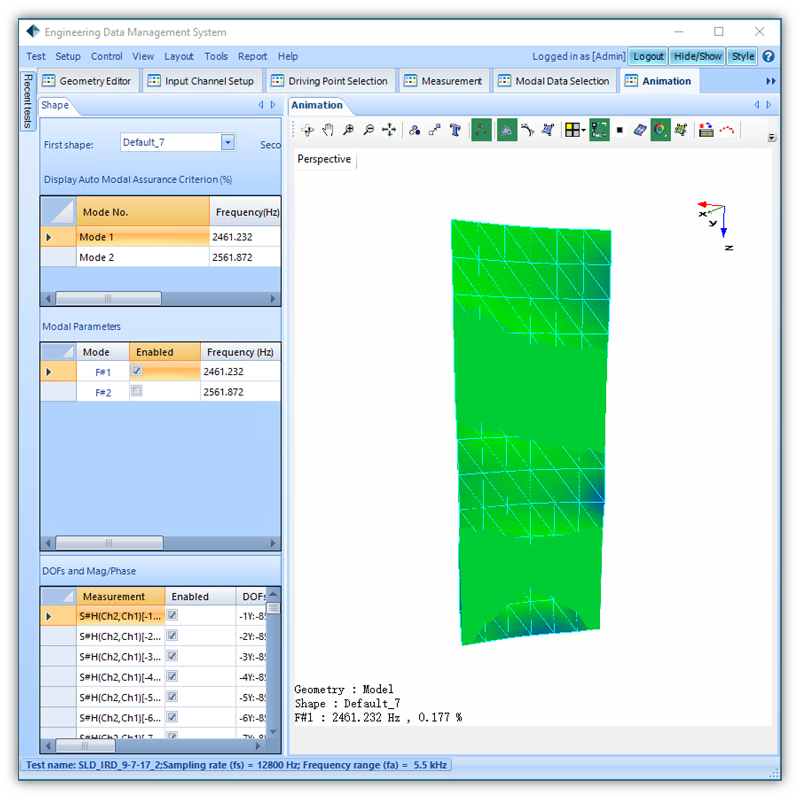
COMPLEX MODE INVOLVING FLEX AND TIP TWO STRIPE
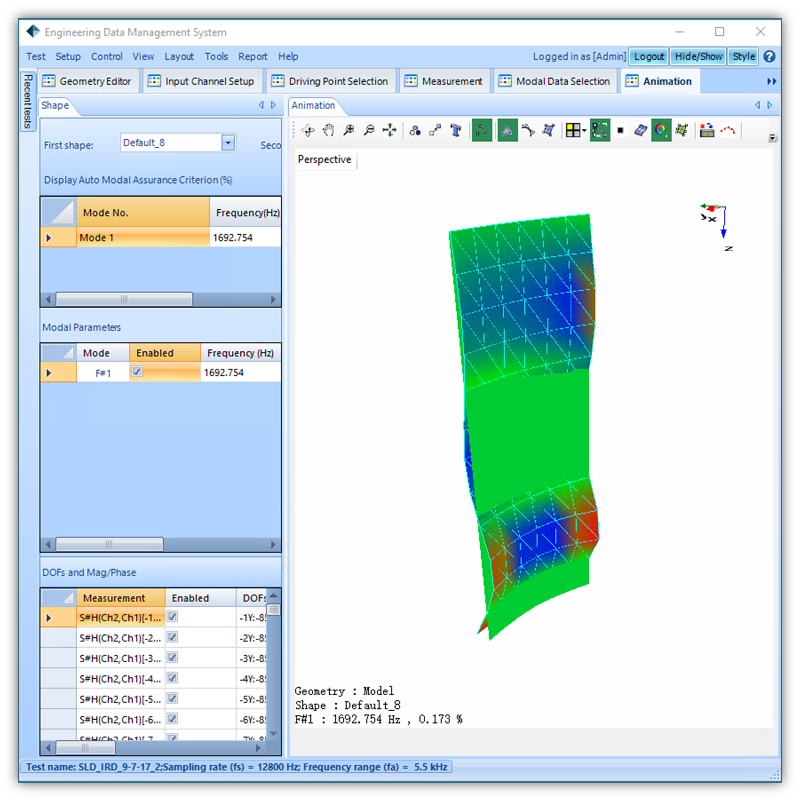
4TH FLEX (4F)
From start to finish, the process took less than a day using EDM Modal. This is less time than would typically be needed using the FEA approach – especially when you consider generating the needed 3D scans and modeling efforts.
FEA APPROACH
Once the EDM Modal approach was completed, the same part was analyzed using FEA. The vane was scanned using a FARO Edge ScanArm® and Laser Line Scanner. CAD geometry was built using Geomagic DesignX® and the FEA was done using ANSYS®.
The following figure shows FEA results for the first ten stator vane natural frequencies. The colors represent positive and negative modal displacements and are helpful in identifying the mode shapes. Modes 8 and 10 are the 4th Flex & Flex/Stripe modes. As you can see, they compare quite well with the EDM Modal approach.
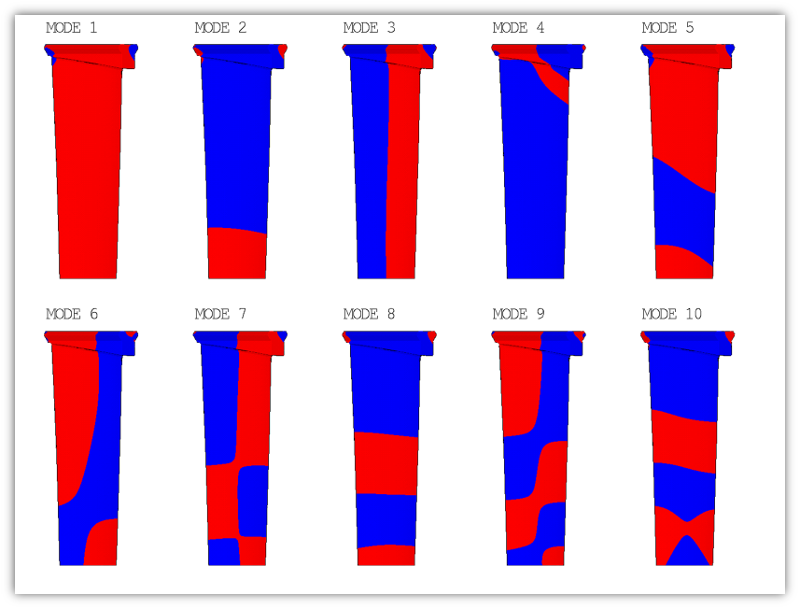
In this case, frequencies were reviewed up through 2500 Hz. The EDM Modal and FEA frequencies were found to be within about 1% of one another. This is an excellent correlation. Especially since the FEA work involved material and geometry approximations. As such, the EDM Modal test results also serve as a great validation tool for the FEA.
CONCLUSION
If your project can benefit from knowing frequencies and mode shapes, the EDM Modal test approach could be exactly what you need. Some benefits include:
- Is extremely fast and accurate
- Doesn’t require detailed 3D models
- No Material properties needed
- Can be used to verify FEA results
Feel free to contact me if you have any questions or if you would like to consider using this type of technology on your project. I can be reached at 1-859-743-0530.
Paul V. Sickles, PE
Stream Lion Design, LLC


